Great search engine optimization (SEO) client dashboards do more than show lines and numbers. They turn your work into a clear, benefit-driven story.
That story links organic traffic to leads, sales, and growth. When clients see that link, trust rises fast. Meetings get shorter. Decisions get easier. And budgets grow.
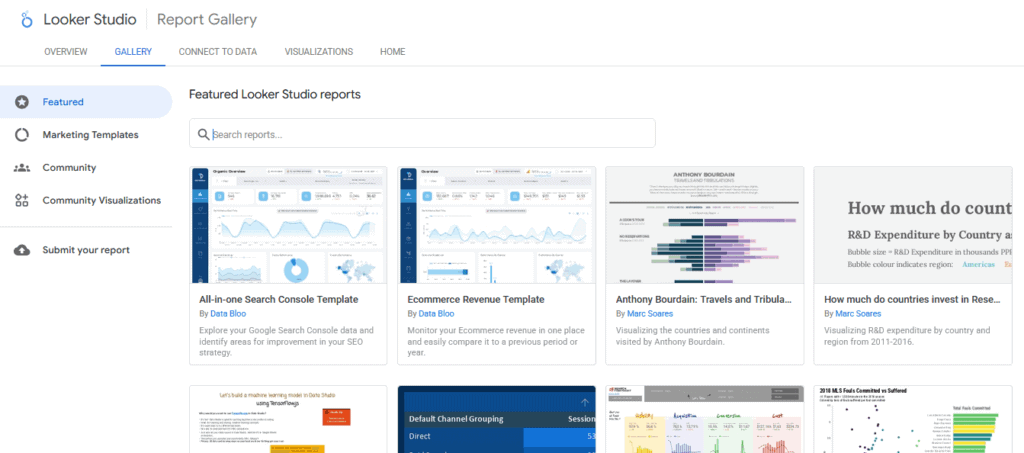
In this guide, we explore how to build an SEO client dashboard that leaders understand at a glance. We will focus on tools like Google Analytics 4 and Looker Studio. You will also see how to include insights like keyword rankings and core web vitals.
By the end, you will have a simple plan that you can ship this week.
Highlights
- The best SEO client dashboards connect traffic, intent, and revenue, and skip vanity metrics.
- The must-have widgets include GA4 conversions, Search Console queries and pages, and backlink analysis.
- Build in Looker Studio with Google Sheets or CSV import. Then share as white label dashboards inside a client portal.
- Use a monthly story flow to make your SEO strategy easy to accept and approve.
- Add QA checks, a change log, and a simple growth plan to build trust over time.
What are SEO client dashboards?
SEO client dashboards are live, shareable reports that turn SEO work into clear insights.
They pull data from primary sources like Google Analytics 4. You can also plug in data from Google Ads, Google Sheets exports, and Google Business Profiles.
The dashboard then visualizes trends, goals, and next steps in a clear and concise view that anyone can easily understand.
How do they work?
You connect trusted data sources, choose key fields, and build tiles like scorecards, trend charts, and tables.
The most common widgets show organic traffic, conversion rates, and the top landing pages.
You can add enhanced SEO visuals, such as backlink profile trends.
Tools that help you build these dashboards often give you access to filters. Filters let a marketing agency or client drill down by device, country, and branded versus non-branded queries without breaking the view.
Why are SEO dashboards critical?
These dashboards turn raw, complex data into snippets and visuals. Your clients can see what’s happening by having a direct view from search to pipelines.
A clean SEO dashboard shows how organic search creates demand and how that demand turns into leads and sales. They reduce guesswork, cut meeting time, and replace vanity metrics with actionable insights.
This makes them an invaluable tool for you and your client.
For the client, these dashboards can track and create a path to more organic business growth.
And for you, well, they help you spot what to double down on and what to fix next. This is how dashboards support a search-to-sale plan, not just a weekly report.
Having more actionable insights gives you leverage to strengthen the business relationship with your clients. They can see that you objectively measure SEO performance for optimal results. The more you help them grow, the more they’ll want to invest in working with you.
Core widgets and layout of an SEO client dashboard
Let’s look at the core widgets and pages you need to include to demonstrate transparency and build trust.
We’ll focus on building these in Looker Studio, as this is a Google product that can access data from hundreds of data sources.
Executive overview
Start with the core outcomes first, and leave the details for other pages.
These include the quarterly and yearly targets that executives want to see, such as organic traffic growth, conversions, and conversion rates.
Use trend charts under each scorecard with period comparison. These visualize long-term growth.
Include a table of the top landing pages by conversions and another for top queries from Search Console. Then, finish with a short insight brief and a note about the next steps. This turns the executive report into a plan.
Why this matters to you: Leaders scan this page in one minute, making it easier to approve your SEO strategy. You’re framing progress as a story, not a list of tasks.
Why this matters to clients: They see the “what” and the “so what.” They also see what will happen next month and why.
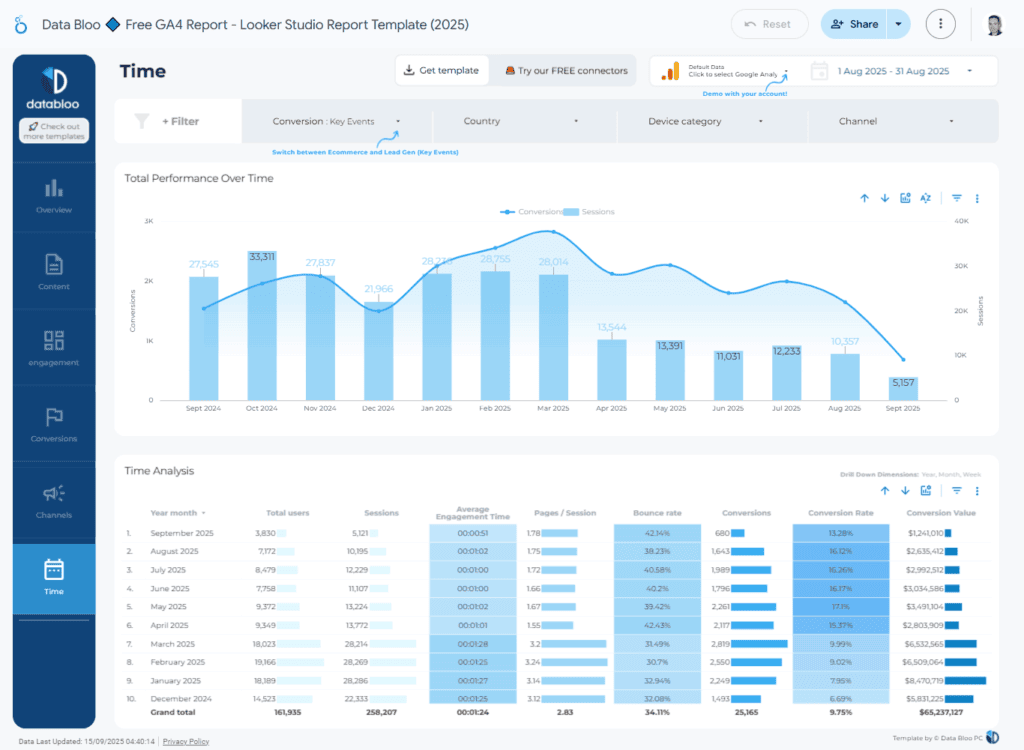
Organic traffic and conversions
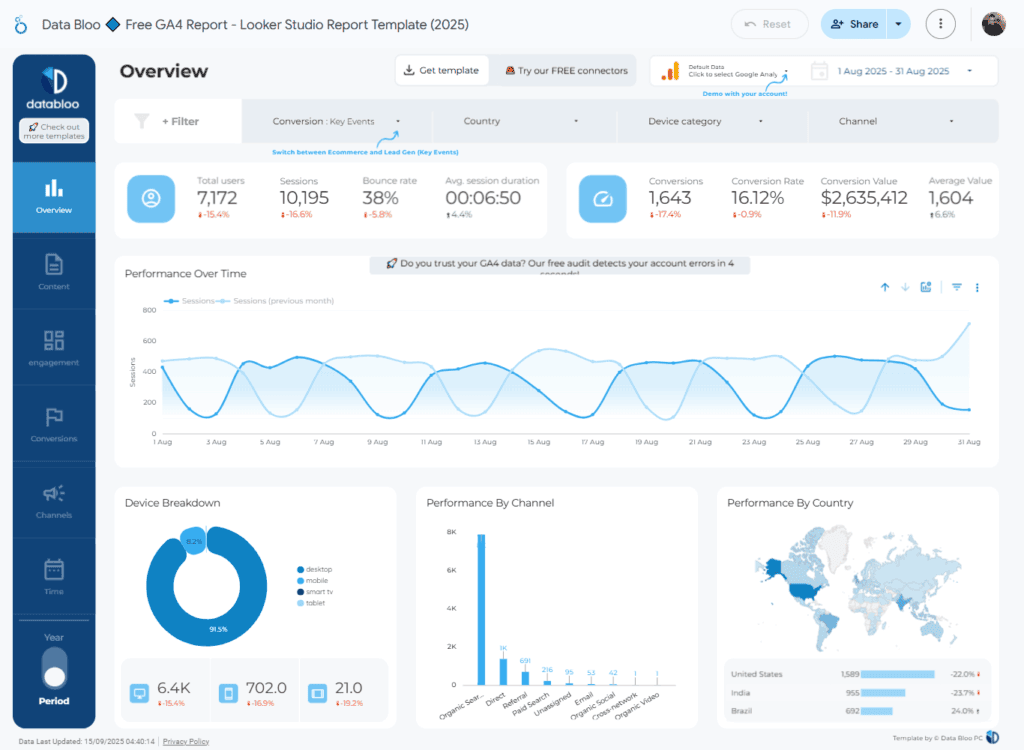
Build Looker Studio scorecards that pull data from Google Analytics 4 for:
- Users
- Sessions
- Organic traffic
- Conversions
- Conversion rate
Add filters to this page so it only focuses on organic search. Then, add a table by landing pages with additional details, such as new users, average engagement time per session, and bounce rates.
Sort these by conversions and show changes from the prior period. Set quick breakdowns by device category and country, especially if your client has an international audience. Add a source filter for large language models (e.g., ChatGPT, Perplexity AI, Gemini, etc.), so clients can see GEO vs SEO performance.
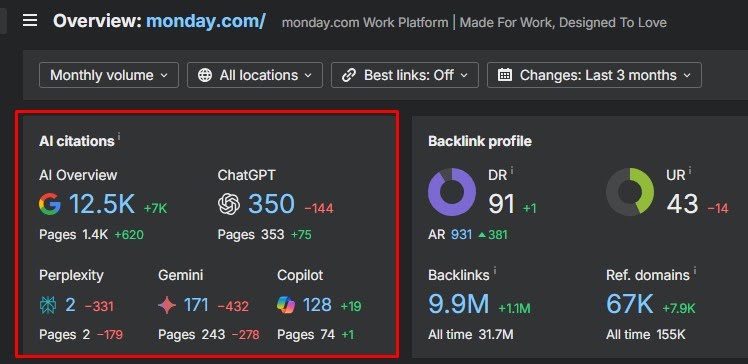
Screenshot provided by author
The next step is to create two views for this page: an in-depth technical one for marketing managers and a summarized version for leadership roles.
Why it matters to you: This page links content and technical health to real performance. You can highlight wins and gaps in seconds.
Why it matters to clients: They see revenue drivers, not a ton of metrics. They can point to pages that create value now and focus on monetizing those topics.
Search demand and visibility
Now show how people find your client’s website.
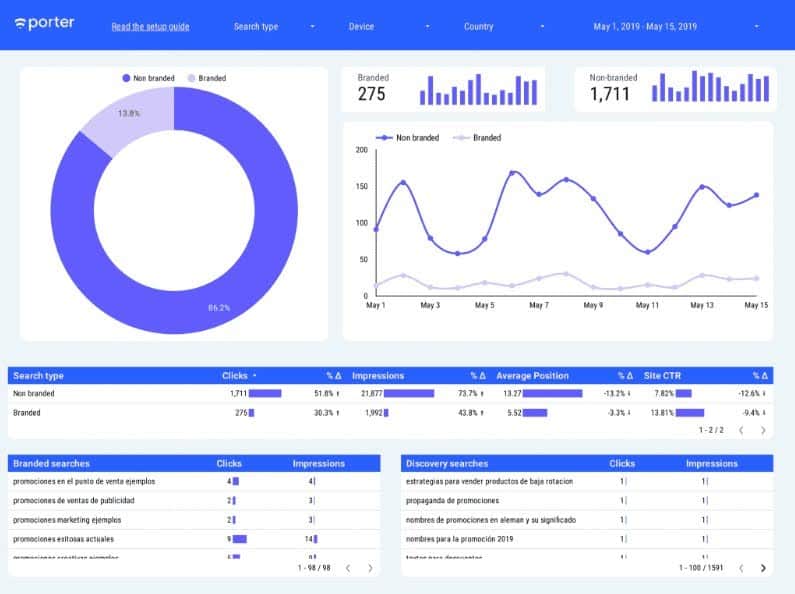
Connect Google Search Console and add Clicks, Impressions, CTR, and Position. Create trend chats for queries and pages.
Place a Top queries table next to a Top pages table so intent meets content in one view. Add a branded vs non-branded toggle. Then, add a simple filter for “problem” and “solution” phrases to surface high-intent topics that help you with developing a content marketing strategy.
Why it matters to you: You spot new clusters and stale pages fast. This helps you plan briefs and internal links with intent.
Why it matters to clients: They see demand rise or fall in plain language. They see which pages answer that demand and are getting the most traffic.
Keyword rankings and share of voice
Context is becoming increasingly important, especially if you want to stay ahead in search with technologies like answer engine optimization (AEO).
Still, do ask for contextual keyword rankings because they know rankings mean more links from traditional search.
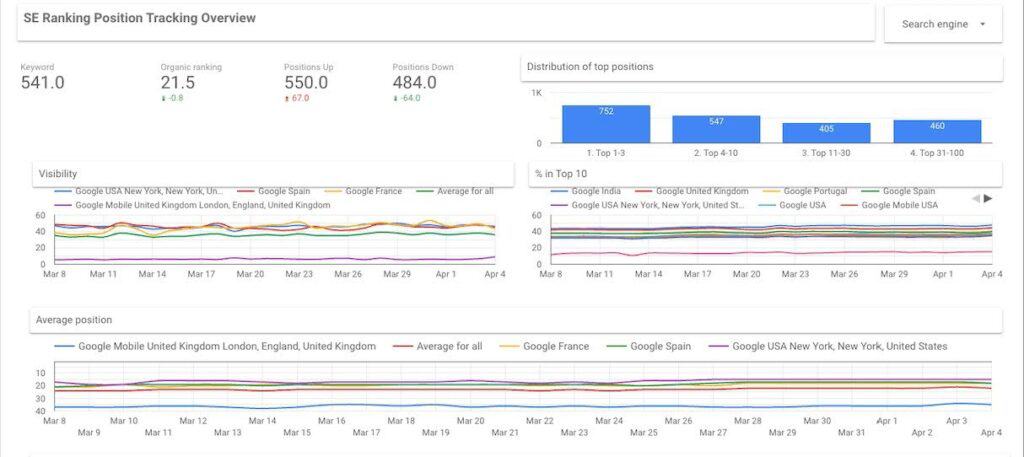
Include keyword rankings, but present them for action. Load tracked terms from a keyword tracker into Google Sheets via a CSV file import system, then connect to Looker Studio. For optimal efficiency, utilize native integrations or API data sources to receive real-time updates.
Show position buckets like 1–3, 4–10, and 11–20. Add a “Top movers” table over the last 28 days. Flag pages that gained after internal links or content optimizations. Keep the color scale simple so that wins and risks stand out.
Bonus: Link Looker Studio (or the data source) to an automated, adaptable SEO checklist for each client. Include the top movers and some of the bottom ones that you can easily improve in 90 days. Focus on these, and your client will see objective, measurable growth thanks to you.
Why it matters to you: You get a “winners and losers” scan that maps to tasks. You can pick the next five updates with confidence. Historical growth serves as proof that you can easily share to attract new clients.
Why it matters to clients: They value SERP rankings, and this view explains change over time.
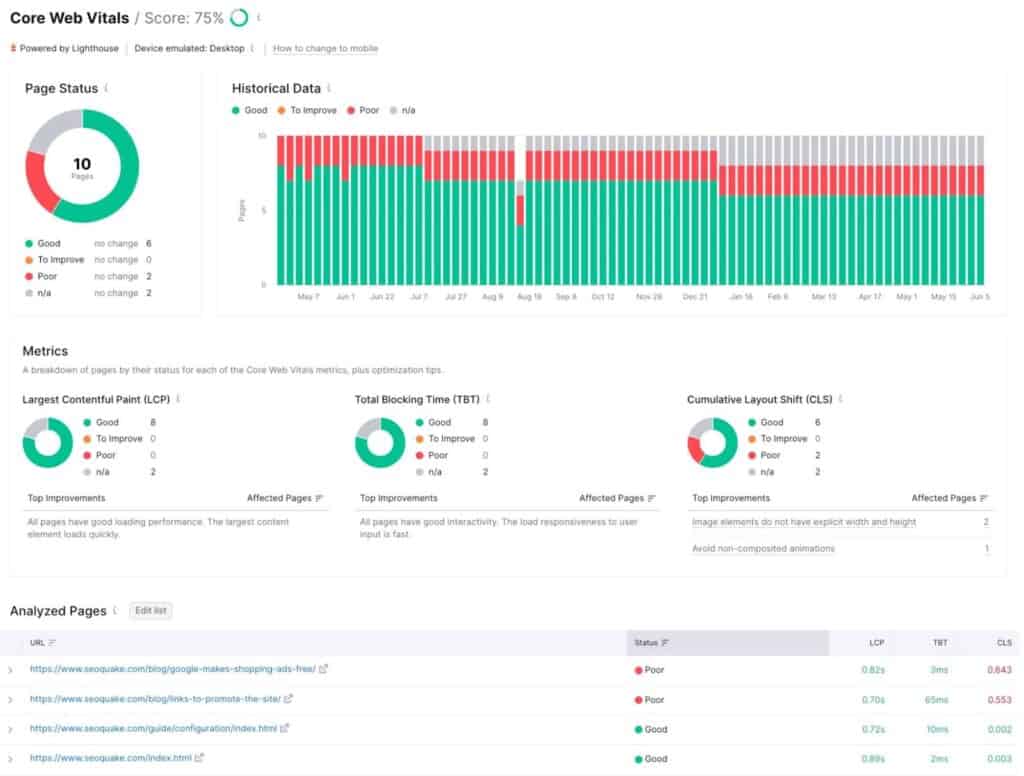
Technical health and Core Web Vitals
Performance shapes user behavior. Users want fast, immediate answers. Slow pages are frustrating, which can increase bounce rates.
Build a technical health page with Core Web Vitals distributions for LCP, CLS, and INP. Pull CrUX data through a connector or bring page load time exports via Google Sheets. Statistics to include:
- Largest contentful paint (LCP)
- Content layout shift (CLS)
- Interaction to next paint (INP)
List failing templates and the pages to fix next. Add a short note about what changed, like a script defer or image preload. Tie speed lifts to conversion rates when you can, as this makes your changes relative to revenue.
According to a web.dev release post, INP replaced the First Input Delay (FID) in 2024 as it had many shortcomings. So, prioritize INP in your audits and reports.
Why it matters to you: You can show a clear fix list and link it to business impact.
Why it matters to clients: They see proof that page performance correlates with user actions and revenue.
Backlink profile and authority
Leaders want to see link growth and link quality, especially if they’re in a hyper-growth startup stage. If you’re doing link building for SaaS, make sure to include this view.
Import backlink profiles and referring domains. Then, build these charts or views:
- Net new referring domains (week by week)
- Lost domains
- Top linking pages
- Anchor theme table
Include a toxic links review queue so the team can inspect risk and decide on what to keep and what to remove. If you show domain trust, note that they are directional, not targets.
Just make sure that when you chart new and lost links, align your review with Google’s spam policies so manipulative links aren’t counted as wins.
The true goals are relevance, authority, and safe velocity that lift organic search rankings.
Why it matters to you: You can validate backlink outreach strategies at a glance. You see quality and timing, not only raw counts.
Why it matters to clients: They see the scope and value of link work. They also see that you’re watching for risk and making intelligent decisions.
Content intelligence
This view links content produced to outcomes. Track a simple content score, internal/external links per page for new pieces, and a prioritized list of content optimizations by URL.
Rank by potential impact. Include a small content planning backlog so leaders see what is next. This makes your upcoming work transparent.
When a post gets clicks but weak signups, add a small conversion optimization card with one test and a target metric.
Why it matters to you: You always know the next best edit. You focus the team on work that moves KPIs.
Why it matters to clients: They see a system, not random posts. This builds trust in your content strategy.
Local SEO and Google Business Profiles
If the brand serves local areas, add a local SEO dashboard page.
Pull Google Business Profiles data and chart calls, direction requests, profile views, and top queries. If you track photo and post views, include them. Add a “Top cities” table to reveal where interest rises.
Note changes after updates to services, hours, and reviews. This is especially critical for local businesses with low profit margins or tough industries, like bistro restaurants.
Why it matters to you: Local data gives fast wins you can repeat.
Why it matters to clients: They see how actions affect calls, not only views.
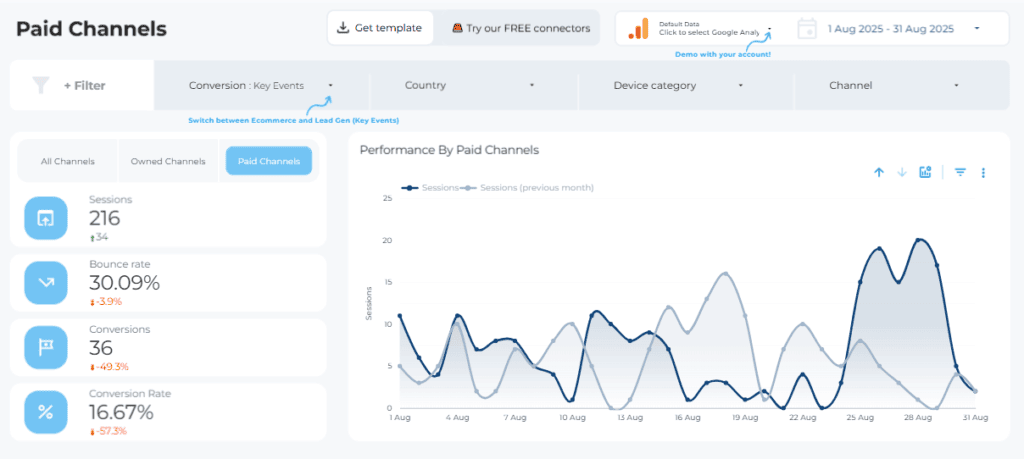
PPC and cross-channel context
If you’re also handling advertising for your client, or they have ads that link to content pages, it helps to create a brief view for quick insights.
Add a short page that shows Google Ads, Facebook ads, and LinkedIn ads in context. Use a channel mix chart with organic search beside paid.
Keep this page tight so you do not turn an SEO dashboard into a full media report. The goal here is context for leadership, not a debate on attribution.
Why it matters to you: You can explain spikes and dips without guessing. You can plan content around paid campaigns.
Why it matters to clients: They see how channels support each other and that your SEO plan also considers their advertising efforts.
Controls, filters, and notes that build trust
Controls and filters make your SEO client dashboards dynamic. You can save presets for leadership roles and SEO managers.
Add change logs on the executive overview page. Log site changes, campaign launches, and tracking edits. Include a box that lists the next three moves. These two boxes turn data into a growth plan that leaders and clients can support.
Why it matters to you: Data becomes explainable, clear, and actionable.
Why it matters to clients: They see actions and results directly tied to the investment in your company.
Building your SEO client dashboard
Trust grows when clients can see the work and the impact in one place. Concise and objective SEO client dashboards connect organic search, user behavior, and performance data to actions and outcomes.
They show what changed, why it changed, and what you will do next. They also make space for content intelligence and technical health, so there’s a clear plan.If you want dashboards that keep pace with search and show clear business impact, consider partnering with uSERP. We blend AI-assisted research, expert content, and proven link building. The result: faster growth and dashboards leaders trust.